Services & Applications · 01

Design & Planning

Energy, cost, payback and label grade quantified before the decision is made.

HVAC system selection & simulation

Our in-house PlantIQ platform and AirCore engine compare HVAC options — VRF or central plant, ice storage or not, air or liquid cooling for data centres — with 8,760-hour annual simulation, so that energy, tariffs, payback and carbon are quantified before the decision. Outputs include flow diagrams, plant-room layouts and equipment schedules (DXF), together with sustainability scoring and financial analysis.
Green building & energy labels: three labels from one model

EEWH 2026, BERS (BERSn / R-BERSn / RP-BERSn) and LEBR 2025 are regression-tested item by item against the official handbooks. The envelope Req task drops from 4–8 hours to 1–2 hours (estimate, pending field confirmation).

  • All 48 handbook examples match; 225 of 231 rows of a real calculation sheet match line by line; Req 10.80% vs 10.81% in the reference sheet
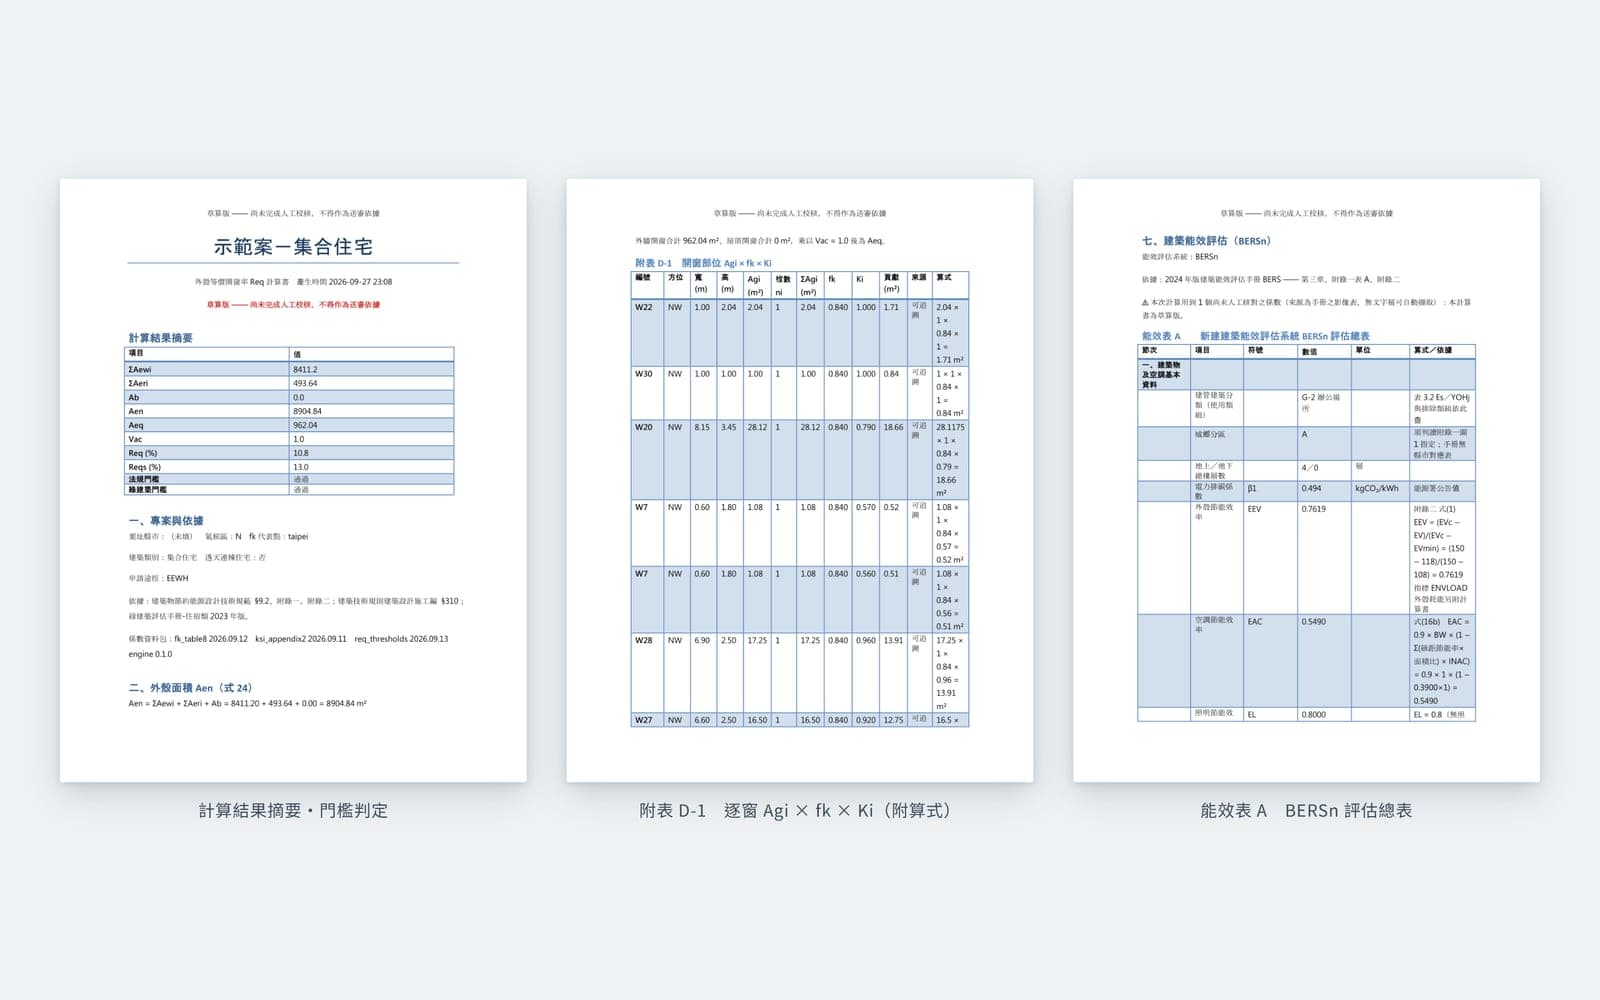
  • Deliverables are submittable, reviewable and reproducible: xlsx / docx calculation sheets with appendices A–G, every sheet with formula columns, coefficient snapshots re-issuable by version
  • No polishing for the firm: unverified coefficients are marked as draft, handbook errata are stated as-is, empty data is rejected, every number is traceable
  • Professional view: the real threshold is often stricter than the code. Code Req < 13%, but EEV ≥ 0.2 works back to 11.80%. Changing glass does not improve Req.

Digital design consultancy

We are a digital consultant supporting design: we do not stamp drawings, compete for design authorship or take design commissions directly from owners. Reports are delivered under your firm’s name, with models, working files and coefficient versions handed over.

  • MODE 1 Design outsourcing: when MEP staff are stretched or HVAC is critical to the project
  • MODE 2 Scoped engagement: when you already have a design team and need simulation and label calculation

In-house platform

PlantIQ

Chiller plant design, simulation and optimisation platform

Built on AirCore, AirFuture's own computing engine, PlantIQ runs every HVAC option through an 8,760-hour dynamic annual simulation on the same loads, the same weather and the same Taipower tariff, and produces energy, cost, investment and editable CAD deliverables in one pass. Topology, loops, control strategy and reports all come from one dataset.

  • Topology-based modellingDrag and drop chilled-water, condenser-water and hot-water loops; primary, primary-secondary, headered or dedicated pumps, 1–8 chillers and towers from templates you then adjust.
  • Hourly annual simulation8,760 hourly steps with per-equipment energy, load duration curves, monthly energy and kW/RT; every model pattern is validated by actual runs.
  • Taipower tariffs and contract capacityThree-tier time-of-use tariffs with demand charges, per-period contract capacity, over-contract penalties and power factor — options compared on cost, not just percentage savings.
  • Investment and sensitivityNPV, IRR, LCC, simple and discounted payback, annual and life-cycle carbon; sensitivity sweeps on contract capacity, discount rate, capex, tariff growth and more.
  • Data-centre air / liquid coolingD2C cold plates, CDU, rear-door heat exchangers, immersion, CRAH / CRAC and dry coolers, with PUE / pPUE, air-liquid split, free-cooling hours and WUE.
  • Drawings and budgetsFlow diagrams, plant-room layouts, equipment schedules, single-line and detail drawings to DXF; construction budgets in PCCES-format Excel.

Platform views

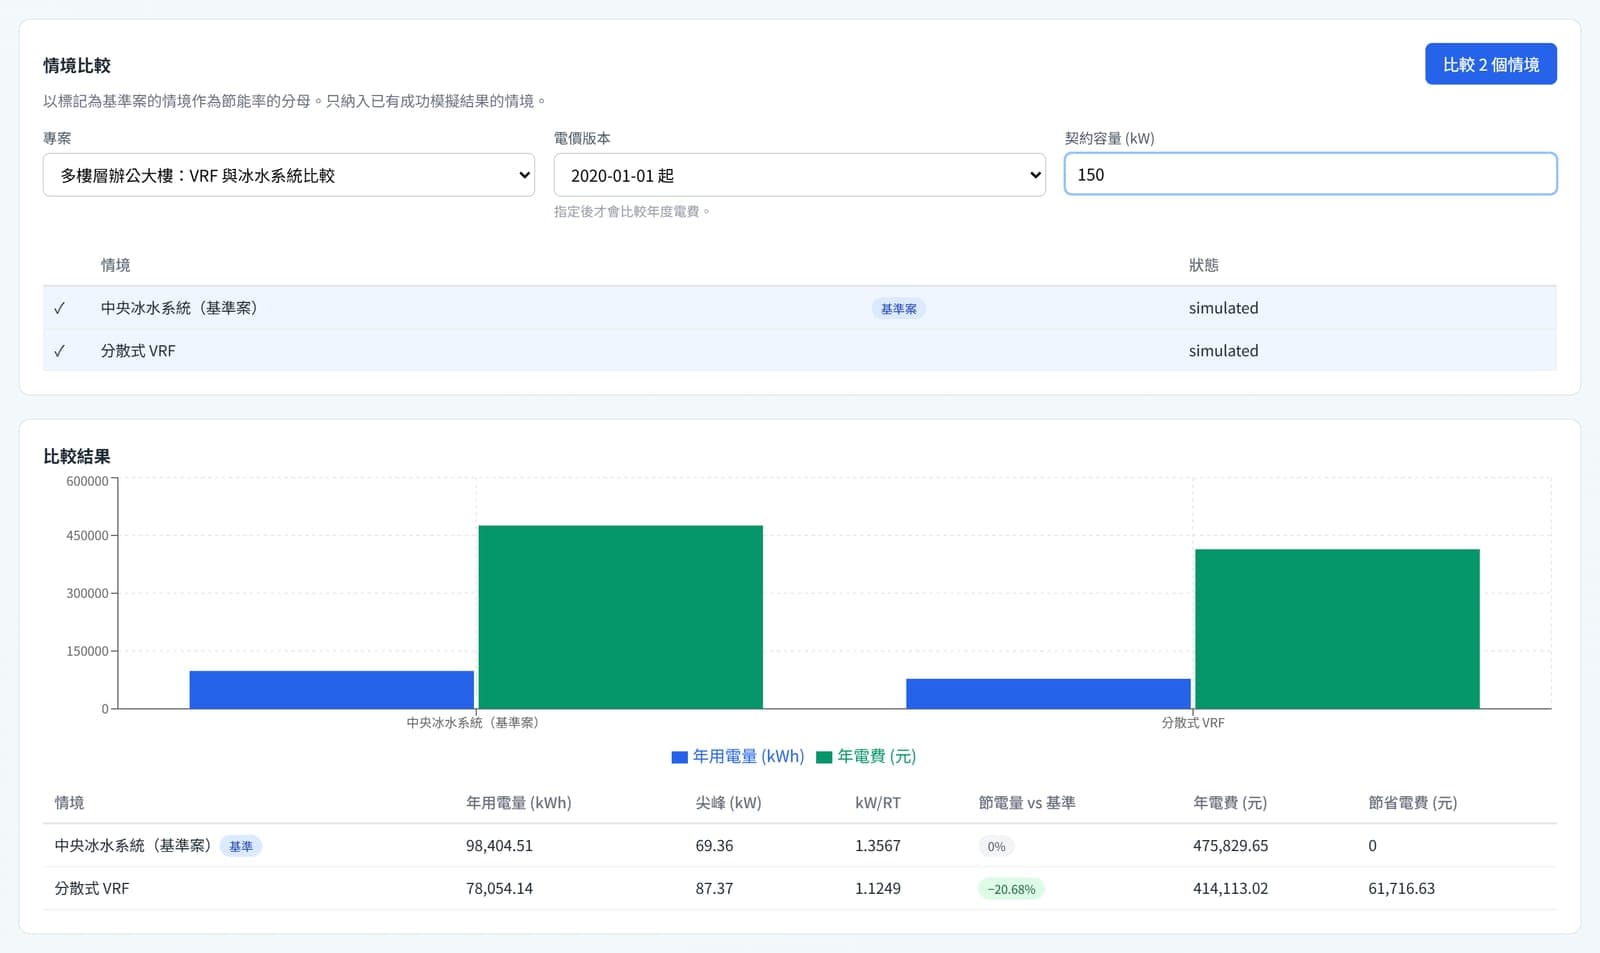
PlantIQ scenario comparison: central plant versus VRF
Scenario comparison: central chilled water versus distributed VRF on the same load — annual energy, peak, kW/RT and annual cost side by side.
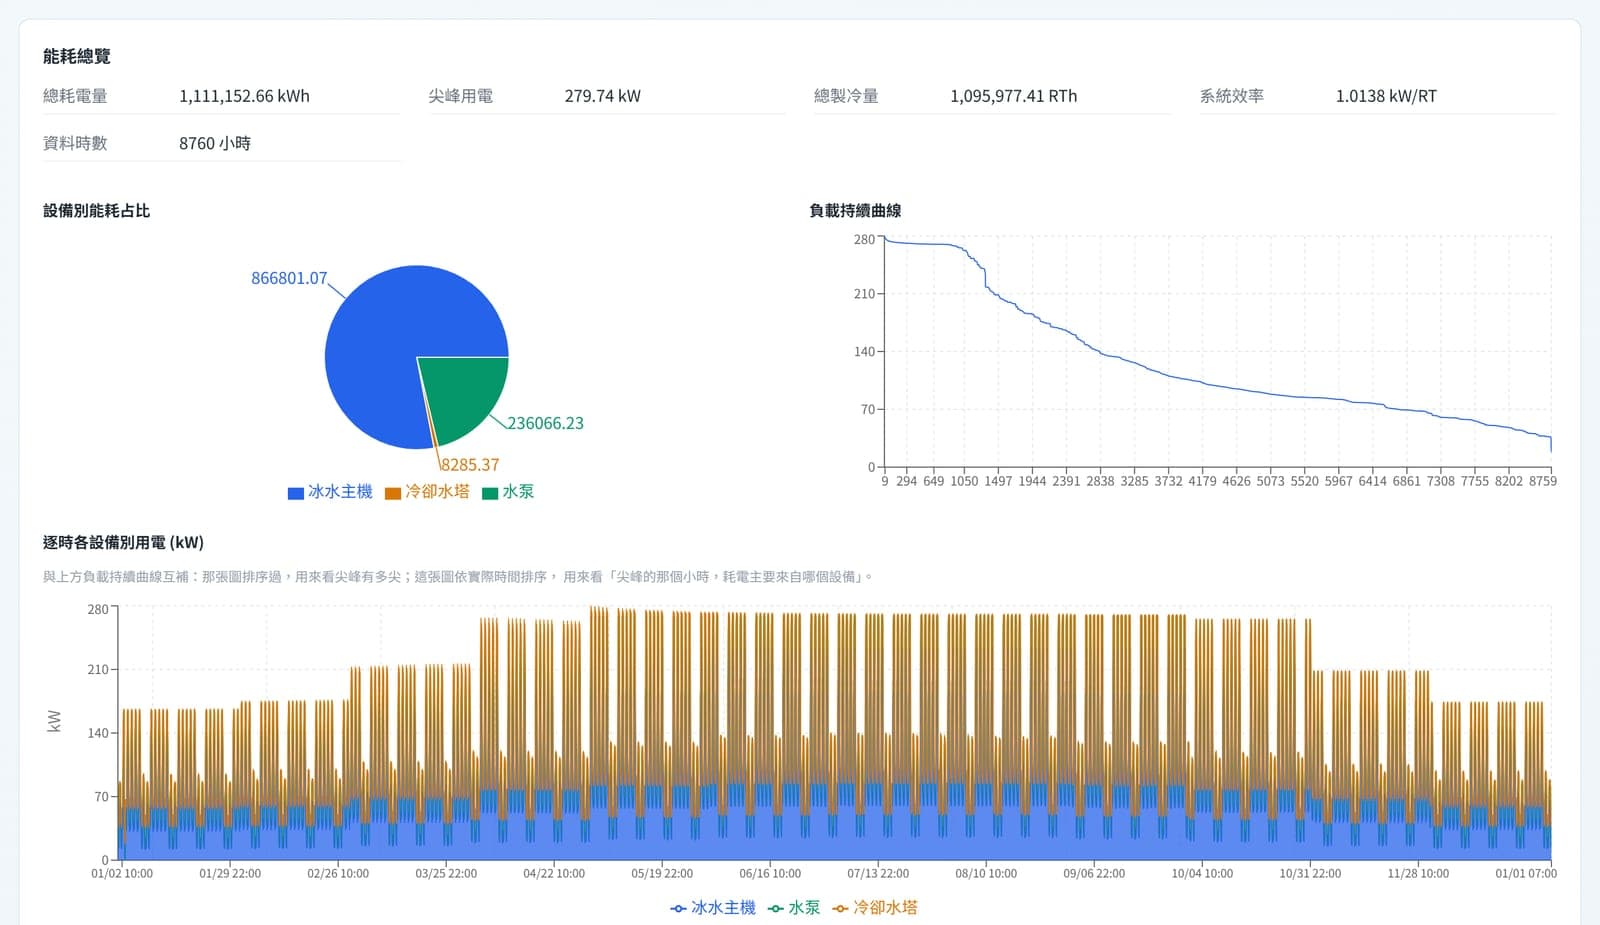
8,760-hour annual simulation results
8,760-hour annual simulation: energy share by equipment, load duration curve and hourly per-equipment power.
Investment and carbon analysis
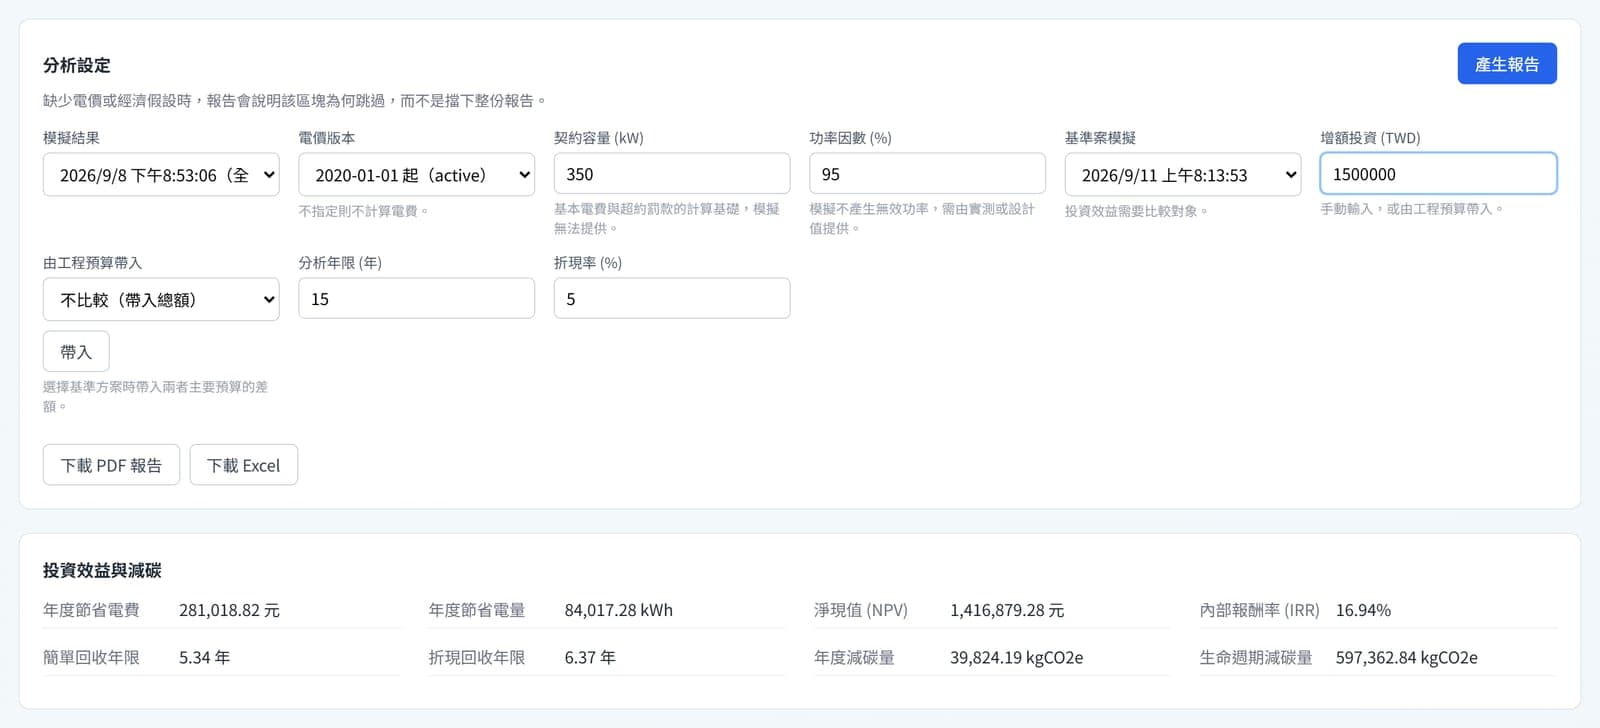
Investment analysis: annual savings, NPV, IRR, payback and carbon reduction, downloadable as PDF / Excel.
Drawing index and auto-generated flow diagram
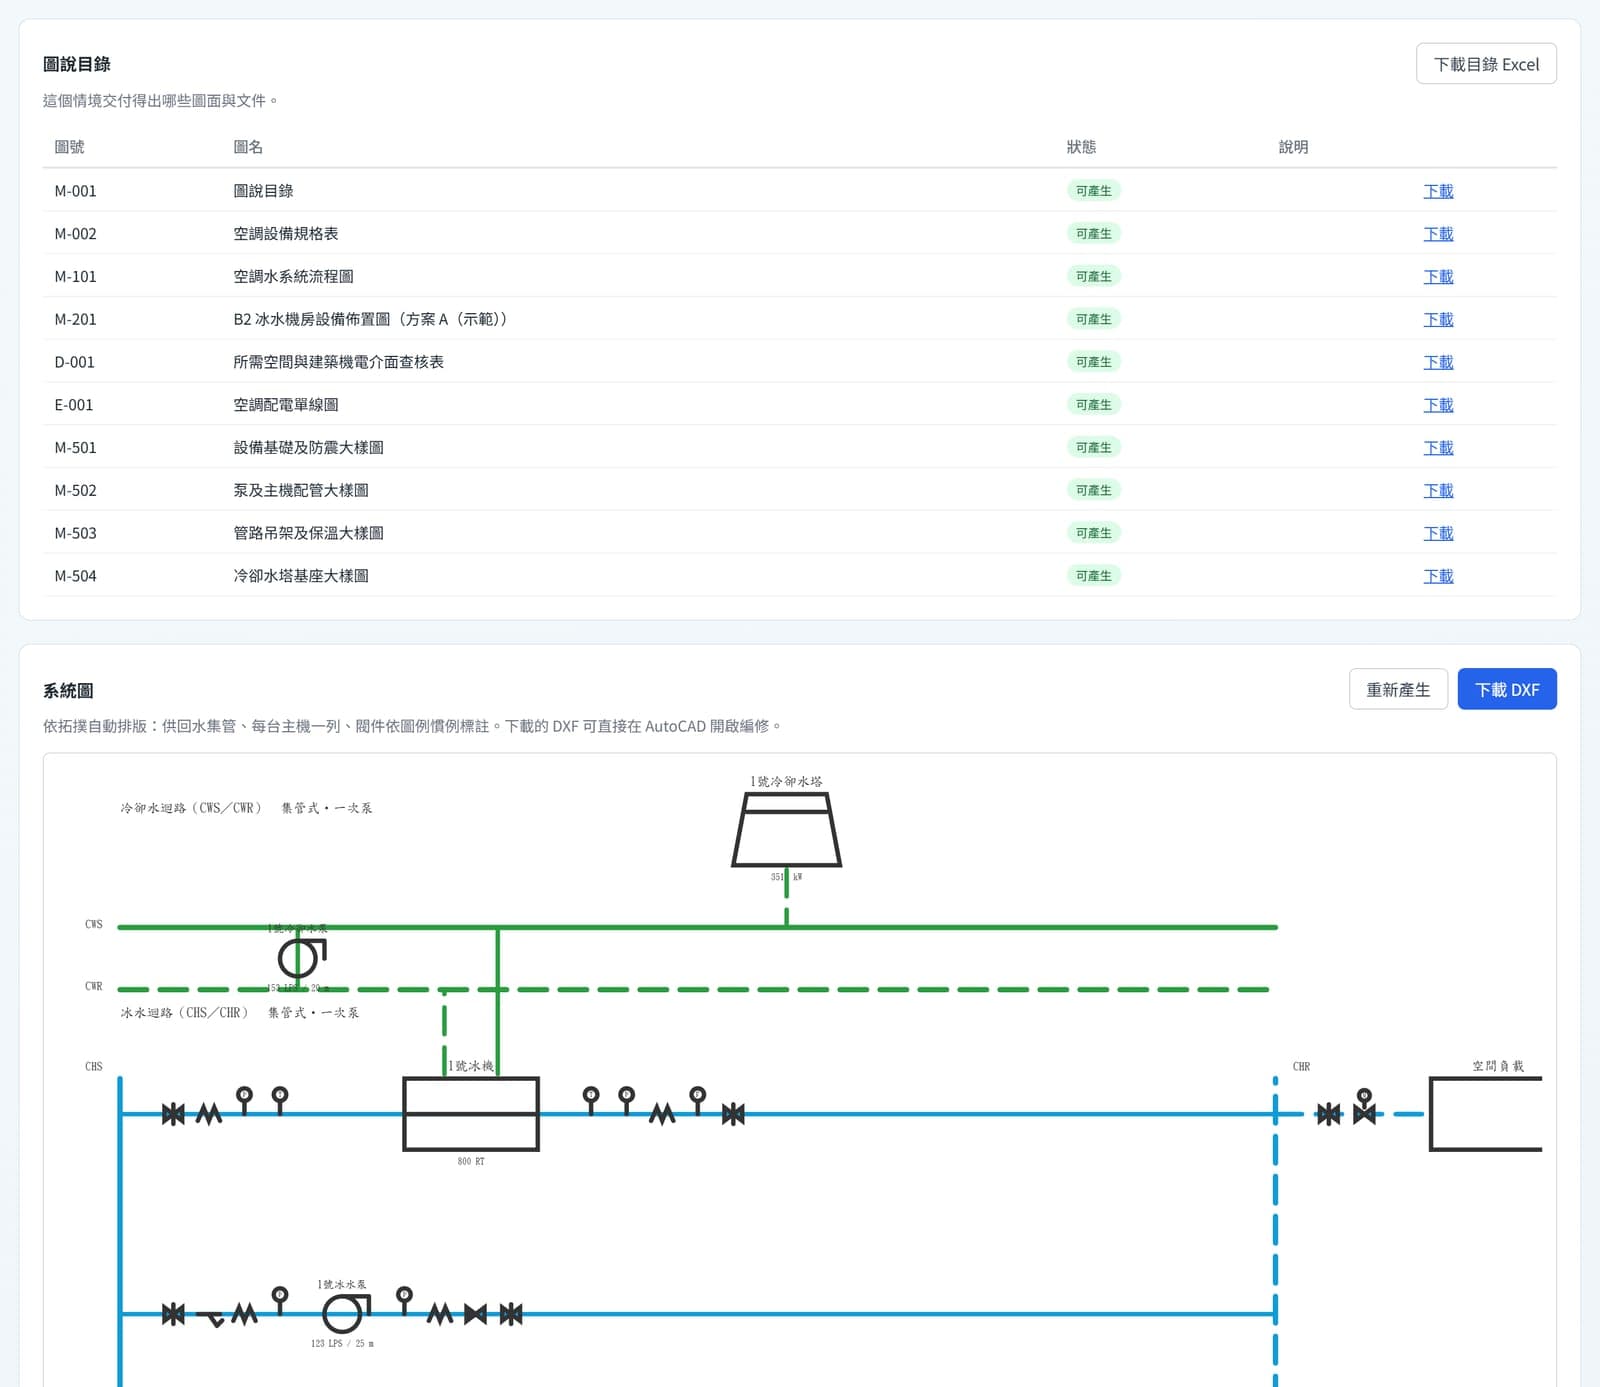
Drawing index and a flow diagram laid out from the topology; DXF opens directly in CAD software.
System topology editor
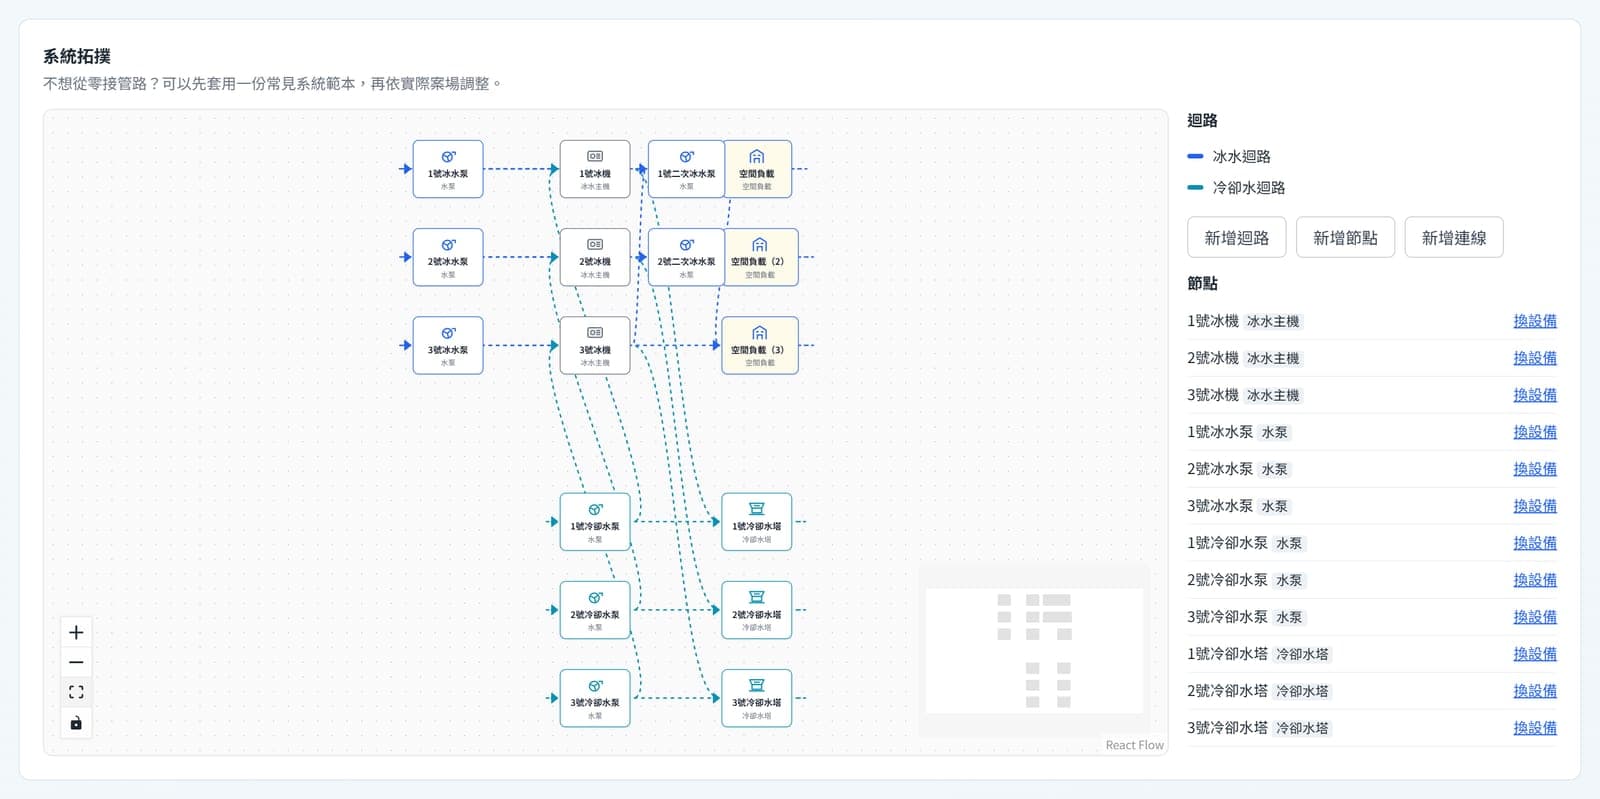
System topology: a three-chiller primary-secondary plant with chilled- and condenser-water loops at a glance.

Demonstration project views; figures are for layout only. DWG import / export and 3D piping are not yet offered, and pipe-length reduction is still a development metric.

Design decisions it supports

Every option is compared under the same assumptions, with the cost of each saving counted. Figures below are platform demonstrations, not guarantees.

System selection

VRF or a central chilled-water plant?

Design question
For a multi-storey office, distributed VRF is simpler and a central plant is more efficient — which actually pays?
How the platform compares
Both systems share one hourly load and weather set and are compared on annual energy, peak demand, kW/RT and annual cost; the VRF case is checked for setpoint compliance so the comparison holds.
What you get
A side-by-side table of energy, peak, kW/RT, cost and capex with payback — both options measured with the same ruler.
Ice storage

Should we build ice storage?

Design question
Peak shifting looks attractive, but does it save money or energy, and does the load shape line up with peak tariffs?
How the platform compares
Conventional and ice-storage plants are compared under Taipower three-tier tariffs on energy charges, demand charges and annual bill; existing storage gets day-ahead load forecasting and 24-hour optimal scheduling against no-storage and rule-based baselines.
What you get
Demo (180 RT mall): annual energy +2.6%, annual bill −10.2%; the same model with an office load profile cuts the bill by only 0.06% — load shape is what matters.
Data centre

Is air-to-liquid cooling worth it?

Design question
Rack density is rising and all-air CRAH cannot keep up; what PUE does cold-plate liquid cooling reach and how many free-cooling hours?
How the platform compares
Models IT design power, hourly utilisation and liquid capture ratio, comparing all-air with hybrid D2C liquid cooling (cold plate + CDU + dry cooler + CRAH), with supply-temperature sensitivity sweeps.
What you get
Demo (IT 400 kW, 75% capture): PUE 1.28 → 1.12, HVAC energy −58.6%, facility energy −14.6%, with air-liquid split and WUE.
Heat recovery

Can condenser heat serve the heating load?

Design question
Process or domestic hot water runs on boilers while chiller condenser heat goes to the towers.
How the platform compares
Compares built-in chiller heat recovery with a plate heat exchanger route on annual heat delivered and chiller efficiency change, converted to boiler fuel avoided.
What you get
Annual heat delivered, chiller energy increase, boiler fuel saved and payback for each route.
Plant room

Will it fit, and how much pipe?

Design question
Equipment is selected, but column positions, service clearances and rigging routes usually clash only at shop-drawing stage.
How the platform compares
Places equipment on the plant-room plan and automatically checks boundaries, overlaps, service clearance, headroom and rigging routes, estimating pipe length and footprint.
What you get
A violation-free layout, estimated pipe length, and editable DXF plant-room layout and flow diagram.
Retrofit

Replace or retune — how much is really saved?

Design question
Replacement proposals are easy to write; nobody can say how much they will actually save.
How the platform compares
Baseline and improvement cases simulated for the full year, with chiller staging, pumps, towers and water temperatures jointly optimised, every saving priced against its cost, and M&V planned under IPMVP.
What you get
Design-day demo: pumps −27.9%, towers −22.4%, plant total −5.9% (simulated); with cost, payback, NPV / IRR and an M&V plan.

Analyses and drawings

Reports state their assumptions and approximations, inputs are listed as given, and every model can be re-run or re-issued at a specified version.

The optimisation methods behind chiller staging, ice-storage scheduling and layout suggestions are AirFuture core technology; this page describes outcomes only.

Energy and cost

  • Energy overview and per-equipment breakdown, load duration curve, hourly and monthly energy
  • Monthly Taipower time-of-use bills: demand charges, over-contract penalties, power factor
  • Ice-storage dispatch, heat recovery and data-centre PUE / WUE analyses
  • PDF and Excel reports (overview, equipment, monthly bills, hourly energy, assumptions)

Investment

  • NPV, IRR, LCC, simple and discounted payback
  • Annual and life-cycle carbon reduction
  • Sensitivity sweeps: contract capacity, discount rate, capex, tariff growth, horizon, emission factor
  • Multi-option scenario comparison

Drawings (editable DXF)

  • M-101 HVAC water flow diagram
  • M-201 plant-room equipment layout
  • M-002 equipment schedule, D-001 space and building-services interface checklist
  • E-001 single-line diagram, M-501–504 detail drawings

Budget and verification

  • Construction budget: PCCES-format Excel with summary PDF
  • M&V report: Energy Administration format Word (IPMVP B / C / D)
  • Control strategy and setpoint recommendations (outcomes only)

In-house platform

Green building & energy label platform

EEWH · BERS · LEBR calculations that can be submitted, checked and re-run

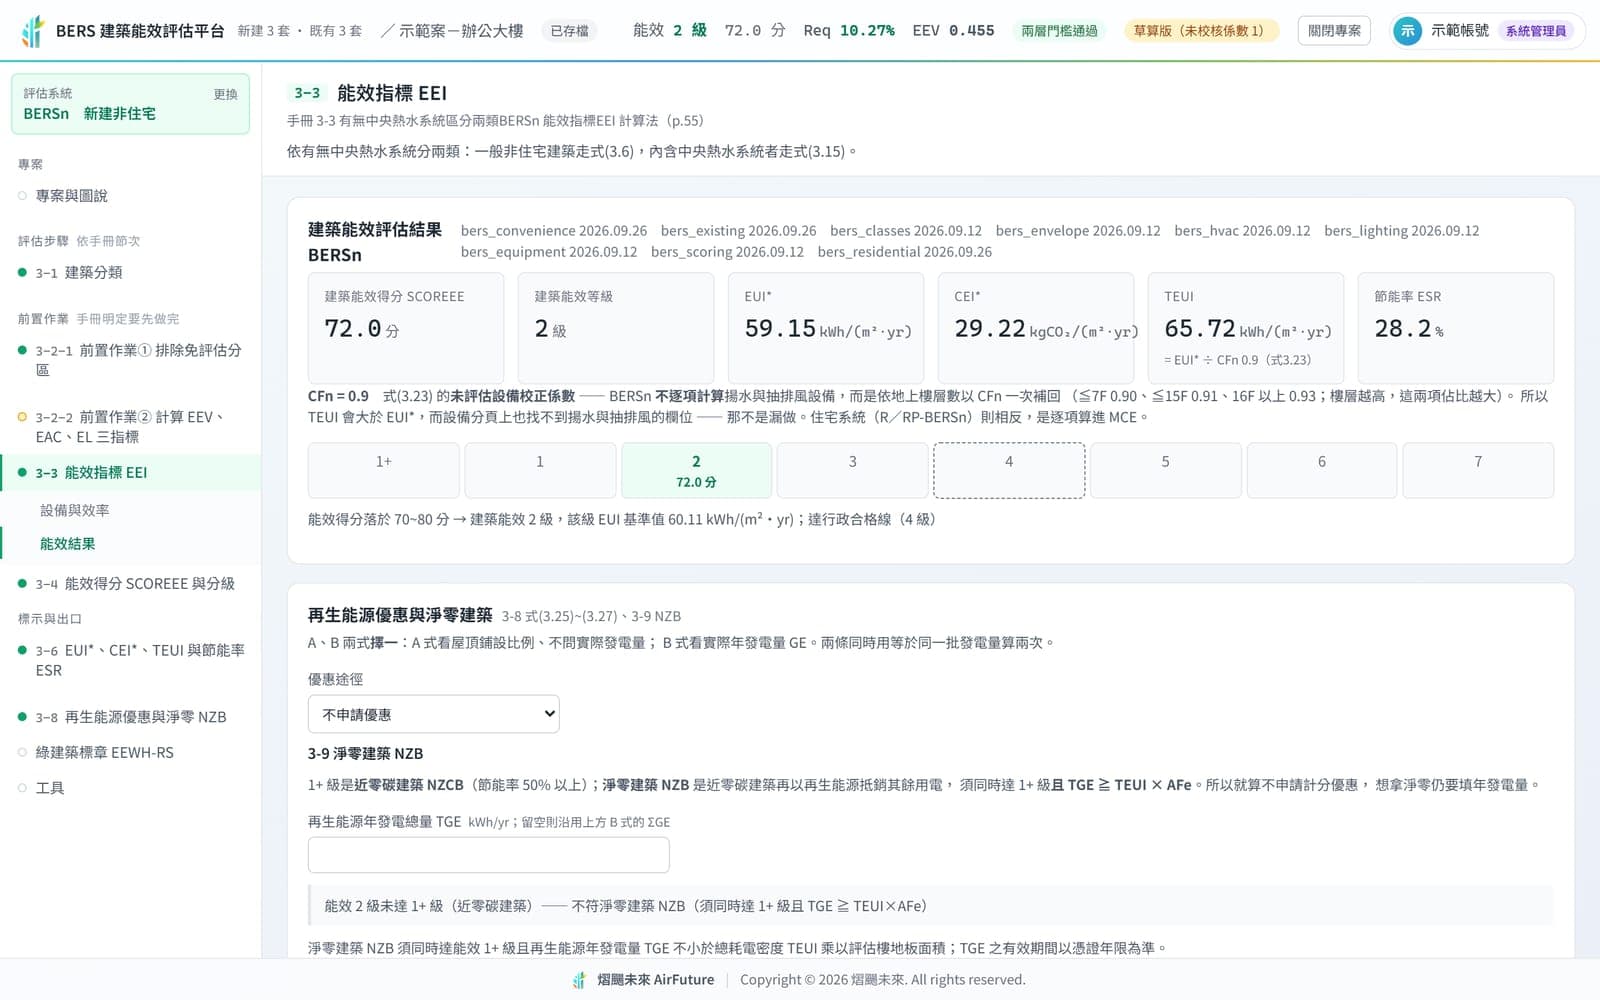
Implemented clause by clause from the 2024 Building Energy Rating manual, the building energy-saving design code and the EEWH 2026 / LEBR 2025 manuals, and regression-tested against every worked example. Every figure carries its formula and coefficient version, and stays marked "draft" until a person has checked it.

  • Six rating systemsBERSn / R-BERSn / RP-BERSn for new buildings and BERSe / E-BERSe / BERSc for existing ones, each with its own calculation boundary — the wrong system gives a plausible score from the wrong formula.
  • Complete envelope indicatorsReq equivalent window ratio, EEV, SF, skylight HWs, Uaw / Uar / Rvi and ENVLOAD / AWSG, judged against both the code and the green-building threshold.
  • Drawing-assisted extractionWindow data extracted with assistance from DXF drawings and window schedules, or imported from an existing calculation book window by window; envelope perimeter and shading stay with the engineer.
  • Energy grade and net zeroSCOREEE, the 1+ to 7 grade scale, EUI* / CEI* / TEUI and savings ratio, with renewable-energy credits and net-zero (NZB) conditions checked.
  • EEWH 2026 and LEBR 2025Green-building indicators and grades, the four embodied-carbon stages and CFR; LEBR results feed the EEWH indicator without re-entry.
  • Quality gatesCoefficient-pack snapshots, input hashes and an audit trail; unchecked coefficients mark the book as draft and an empty window list blocks the report.

Platform views

Envelope Req result on the label platform
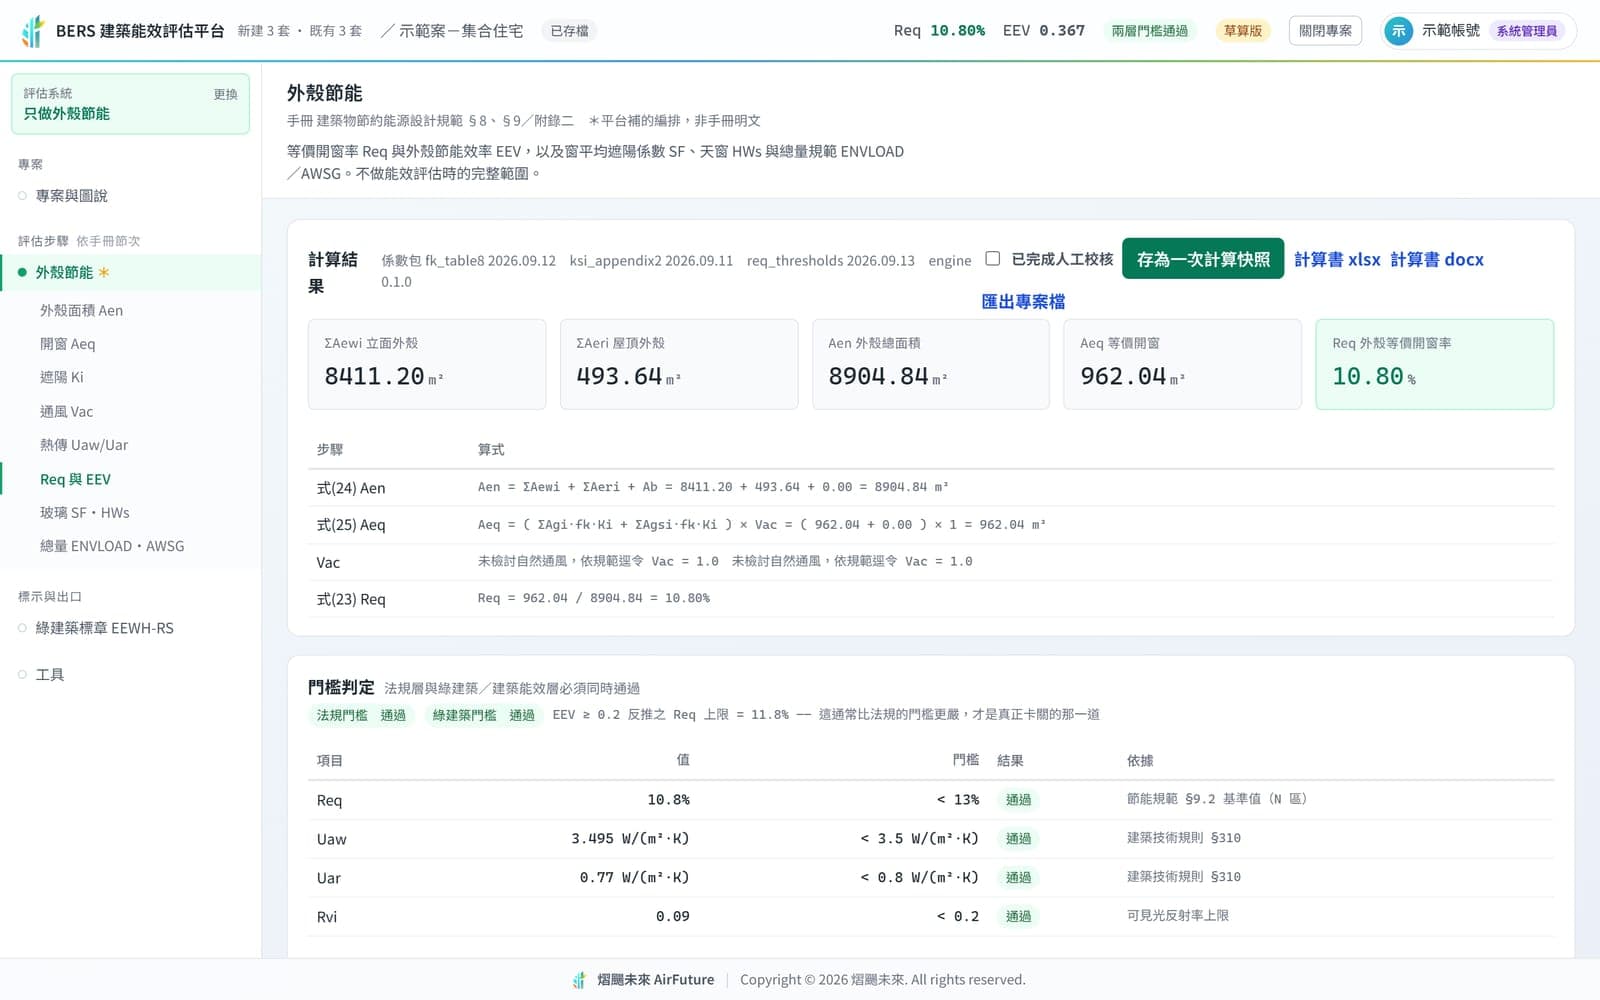
Envelope Req step by step: envelope area, equivalent window area and Req, judged against both the code and the green-building threshold.
Building energy score and grade scale
SCOREEE, EUI* / CEI* / TEUI and the 1+ to 7 grade scale, with renewable credits and net-zero checked.
Submission-format calculation book preview
xlsx / docx book: summary and verdict, schedule D-1 per-window formulas, energy table A.

Demonstration projects use manual worked-example data; the "draft" badge is the platform's quality gate, not a real project.

Design reviews it supports

Four questions we hear most often, and how the platform turns "probably fine" into "calculated".

Envelope Req

Will Low-E glass rescue our Req?

Design question
The equivalent window ratio is slightly over the limit and the first idea is always better glass.
What the platform does
Expands every window's area, orientation and shading contribution, checks both the code limit and the stricter limit back-solved from EEWH EEV ≥ 0.2, and lists the three levers that actually work: external shading, window area and orientation, natural ventilation.
What you get
Req and margin for each option, the two-tier verdict, and the basis for why glass performance changes ENVLOAD / SF but not Req.
Energy grade

Can a new office reach Grade 1 or 1+?

Design question
Public new buildings must reach Grade 1 or 1+ from July 2026; the gap has to be known at design stage.
What the platform does
Sets the baseline from building class and site data, calculates the envelope, HVAC and lighting indicators and SCOREEE, and tests renewable-energy credit routes A / B and the net-zero (NZB) condition.
What you get
Score and grade scale, EUI* / CEI* / TEUI and savings ratio: how many points short of the target and which item to fix.
Multiple labels

One project, EEWH, BERS and LEBR submissions

Design question
Three manuals and three calculation books mean duplicated input that rarely reconciles.
What the platform does
Envelope Req, building energy rating and the EEWH-RS energy indicator are completed in one project; LEBR embodied-carbon results feed EEWH; every book carries the same coefficient version.
What you get
Three submission-format calculation books (xlsx / docx) with formula columns, re-issuable at a specified version.
Book check

Is someone else's calculation book right?

Design question
Taking over a project or before submission, an existing book has to be checked against the manual.
What the platform does
Imports the existing book's window table, recalculates row by row and flags every differing row with its cause.
What you get
Row match rate and a list of differences. Demonstration: 225 of 231 rows matched a real book, Req 10.80% against the book's 10.81%.

Deliverables

Ready to submit, check and re-run; an envelope Req job drops from 4–8 hours to 1–2 hours (estimate, to be confirmed on more projects).

Drawing recognition and row-by-row reconciliation methods are AirFuture core technology; this page describes outputs only.

Calculation books

  • Envelope Req book in xlsx / docx: summary and schedules A–G, each with a formula column
  • Energy tables A–F, table S coefficient sources, table X manual errata
  • EEWH indicator book and LEBR table 6-2 (xlsx / docx / json)

Verdicts and reviews

  • Two-tier verdict against the code and the green-building threshold
  • Grade scale and net-zero (NZB) conditions
  • Improvement levers: which changes work and which do not

Traceability

  • Coefficient snapshots and input hashes, re-issuable at any version
  • Unchecked coefficients keep the "draft" mark until signed off
  • Project export / import and an audit trail

Honest disclosure

  • Envelope perimeter, shading coefficients and urban zone are judged by the engineer; the platform assists
  • Fields not provided stay blank — no invented numbers
  • All 48 manual worked examples match (BERSn 21, R-BERSn 16, RP-BERSn 11)

Application cases (platform demonstrations, simulated)

Demonstration results from the AirFuture platform. Not measured guarantees.

Ice storage: it saves money, not energy

+2.6%
Annual energy
−12.2%
Energy charges
−10.2%
Annual bill

180 RT shopping mall, annual simulation. It only works when the load shape matches tariff peaks: the same model with an office load profile cuts the bill by just 0.06%.

Data centre: air to liquid cooling

1.28 → 1.12
PUE
−58.6%
Cooling energy
−14.6%
Facility energy

IT load 400 kW, 75% liquid capture ratio, 8,760-hour simulation. Architectures modelled: D2C cold plates, CDU, dry coolers, CRAH / CRAC, RDHx rear doors and warm-water free cooling.

Talk to us about the best building energy design and system services for your site.